
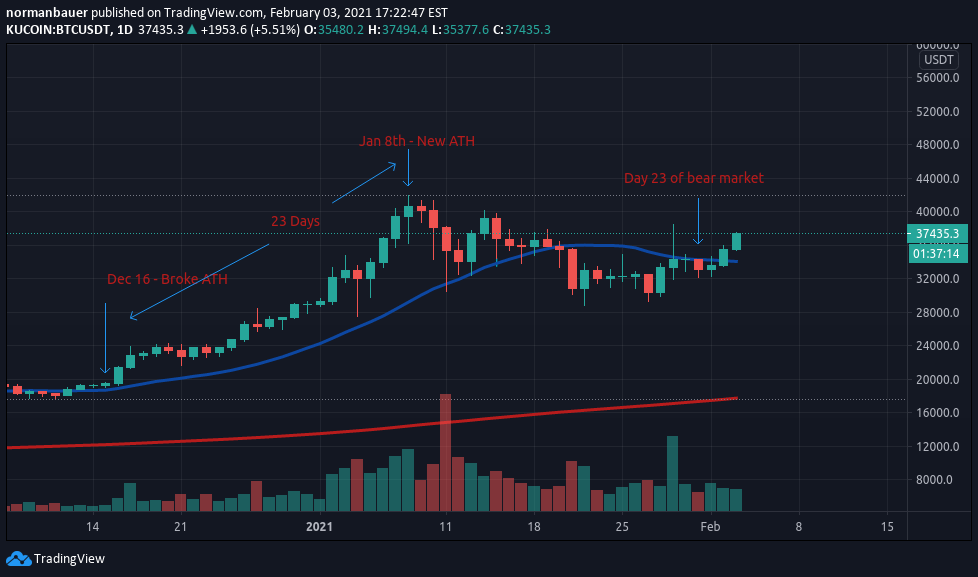
The chart above is $BTC:USDT 1 Day timeline.
It took 23 days from breaking the ATH on Dec 16 to the new ATH on Jan 8. From there the price fell $28,686 at its lowest. Then it went sideways. On Day 23 the price posted one more red candle and then it has been a steady climb up again.
I am not going to analyze this for you, but there seems to be a pattern here. Time will tell if it holds up.
The blue line is the 20MA and the red line is the 200MA.